
Microscopic Damage Mechanisms of Plugging-Erosion in Metal Wire Mesh Filters for Sand Control: A Scientific Analysis of Failure Progression
January 3, 2026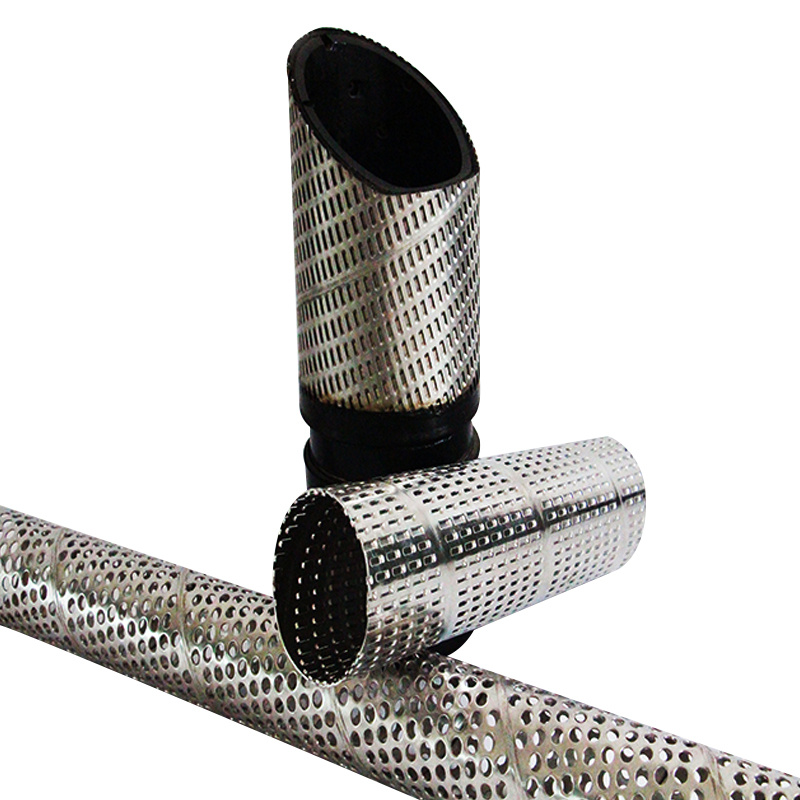
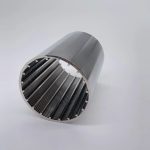
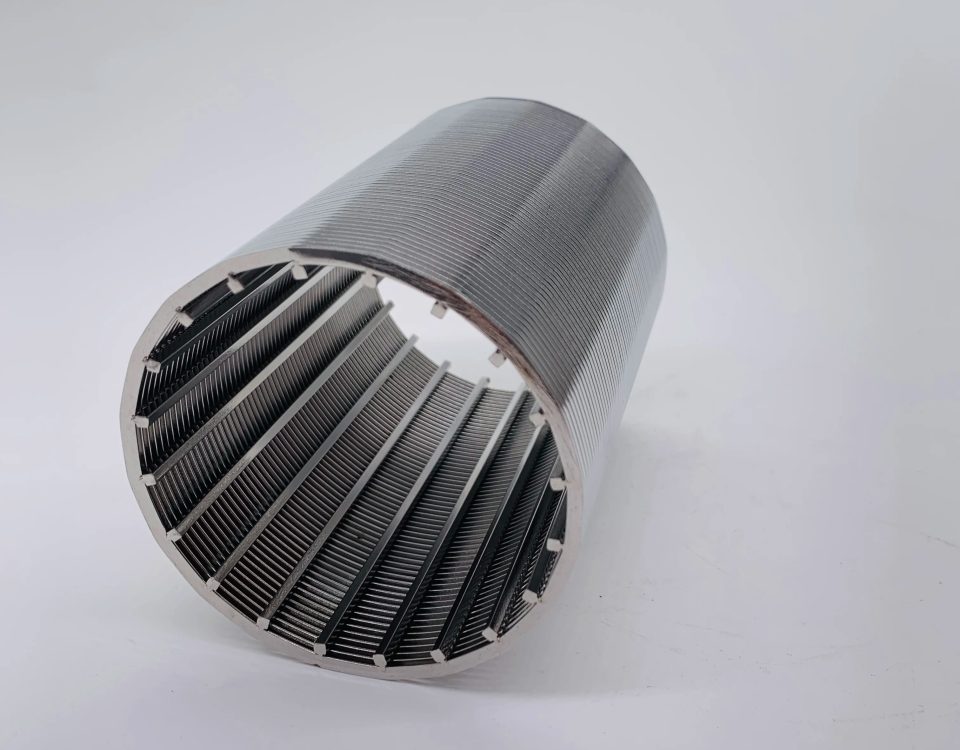
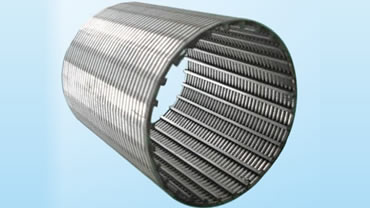
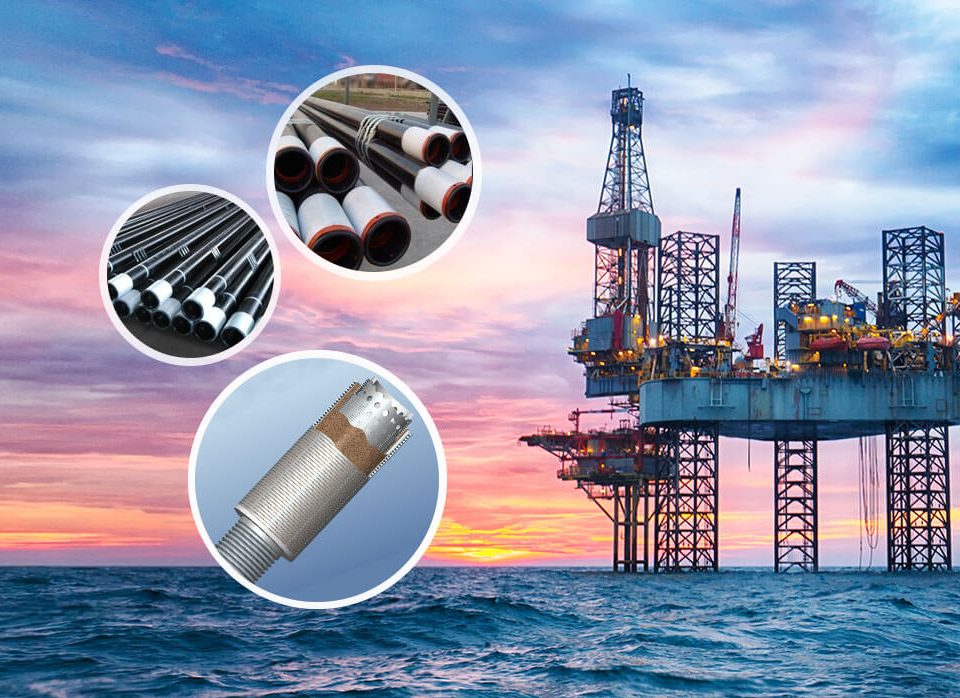
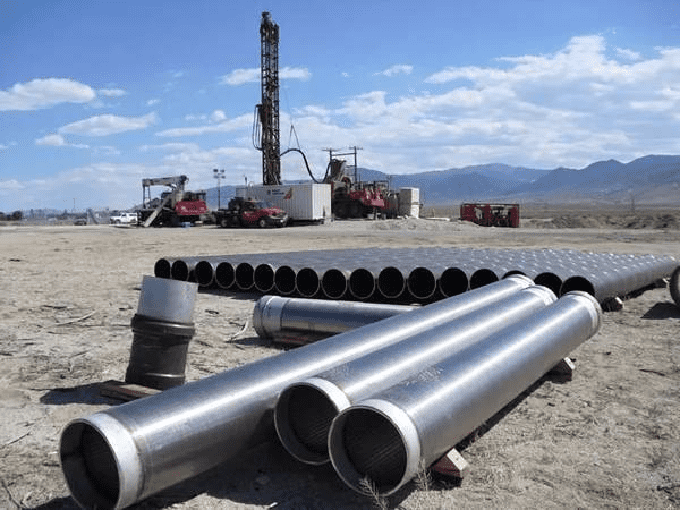
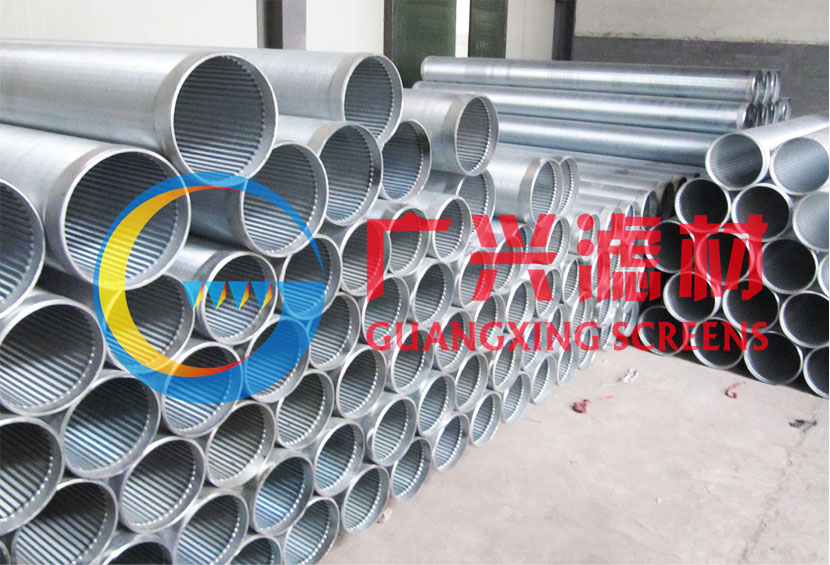
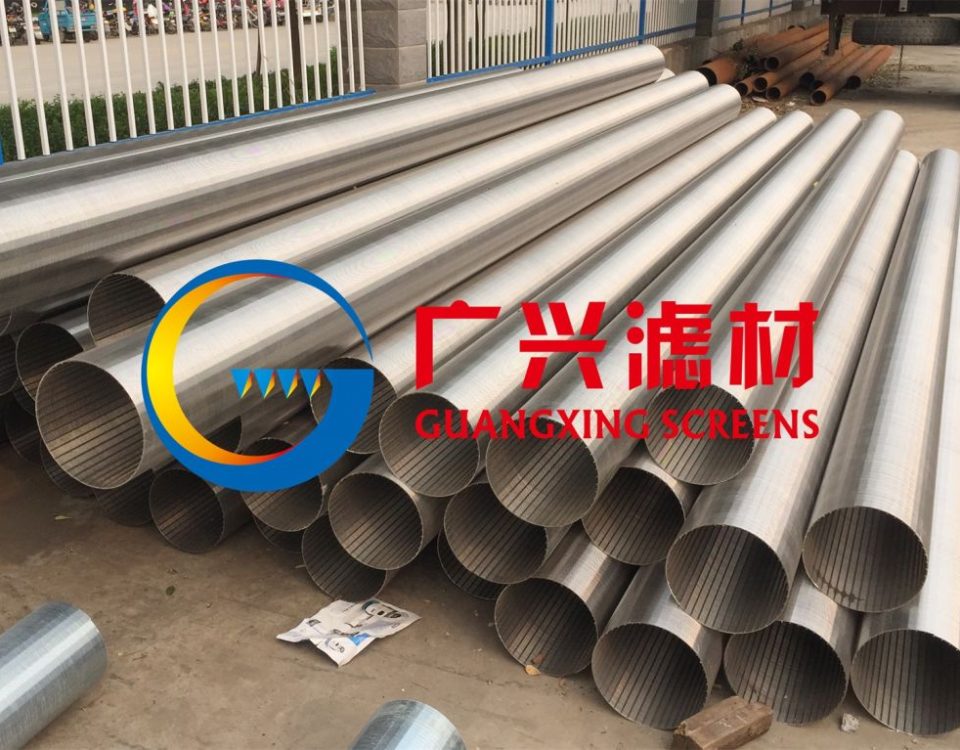
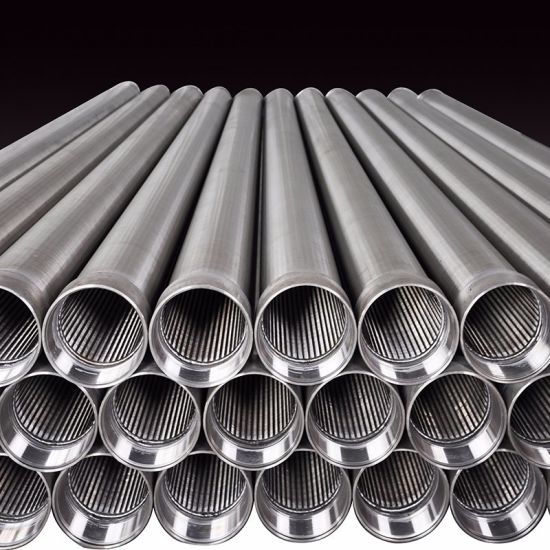
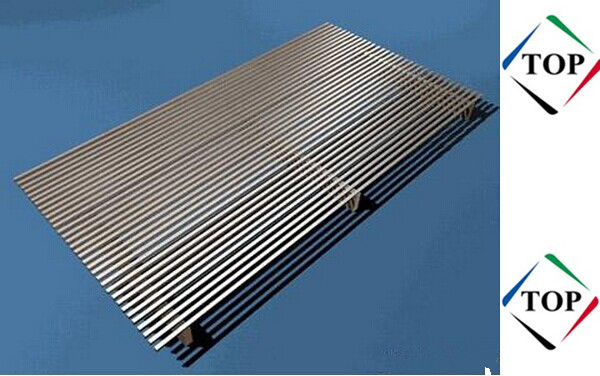
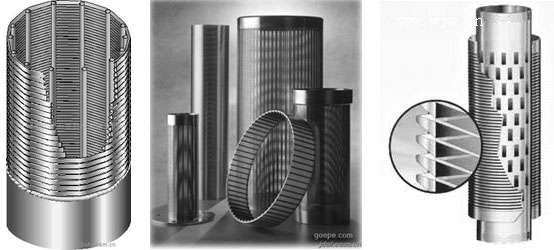
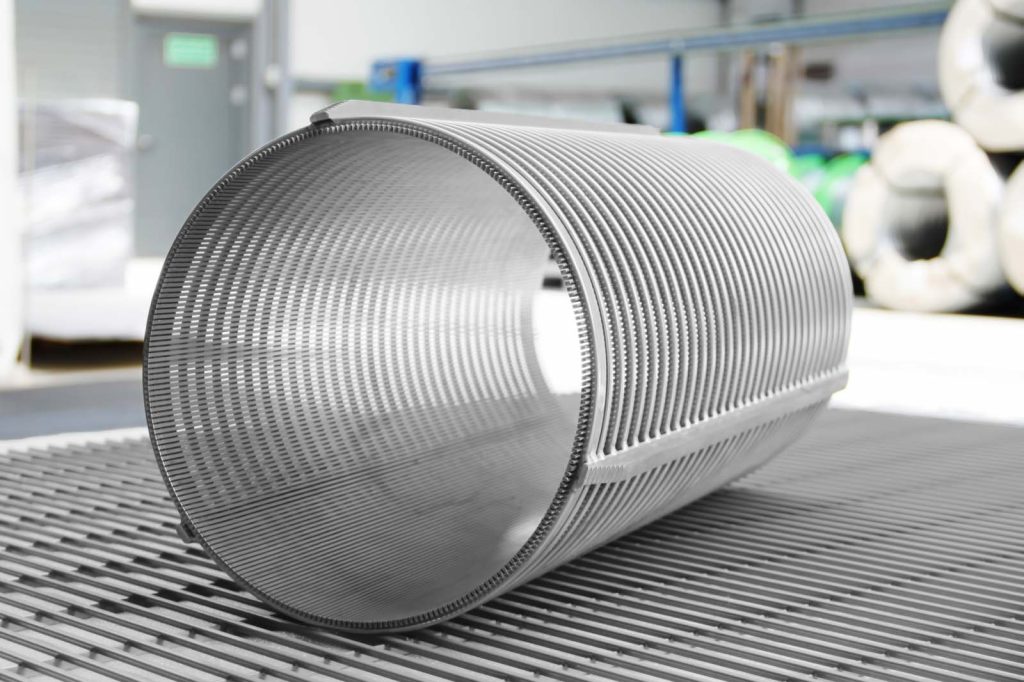
In the petroleum and groundwater sectors, the Stainless Steel Metal Mesh Screen (Johnson type or Woven Mesh) is often hailed as the ultimate barrier against formation sand. However, the industry’s greatest challenge isn’t just stopping the sand; it’s surviving the sand. The transition from a functional filter to a compromised, eroded, or clogged failure point is a microscopic drama of kinetic energy, electrochemical vulnerability, and mechanical fatigue.
The Inner Monologue of Material Degradation: Beyond the Surface
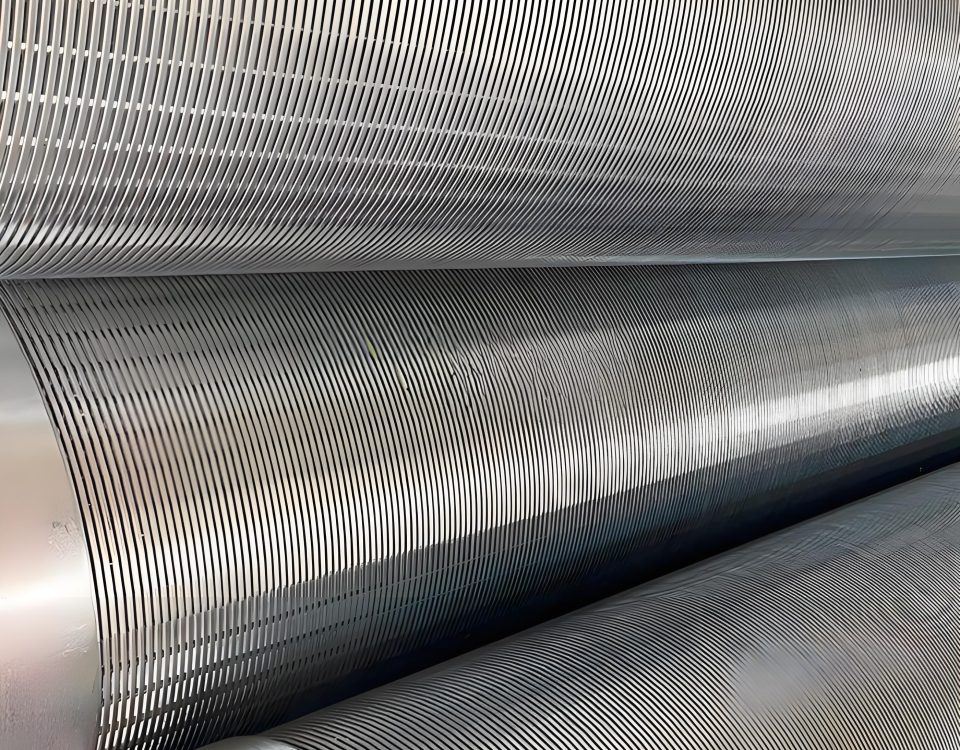
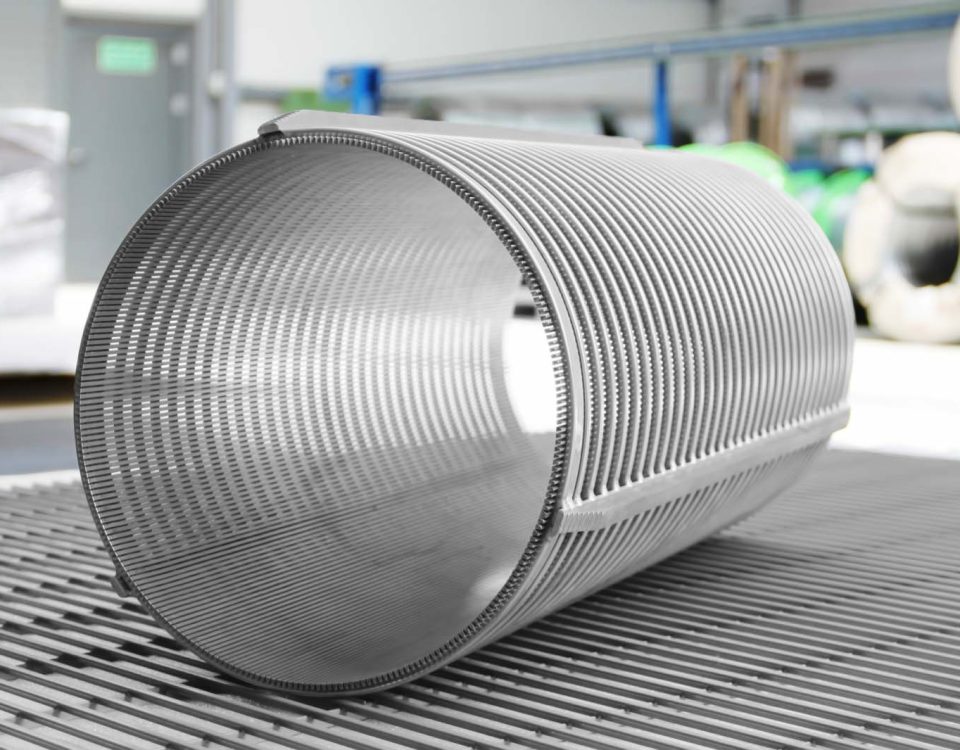
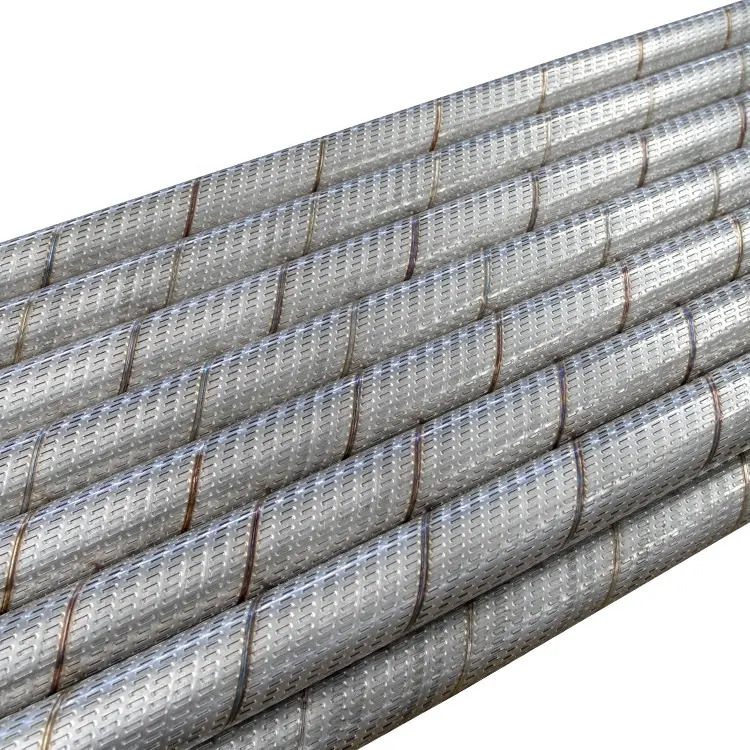
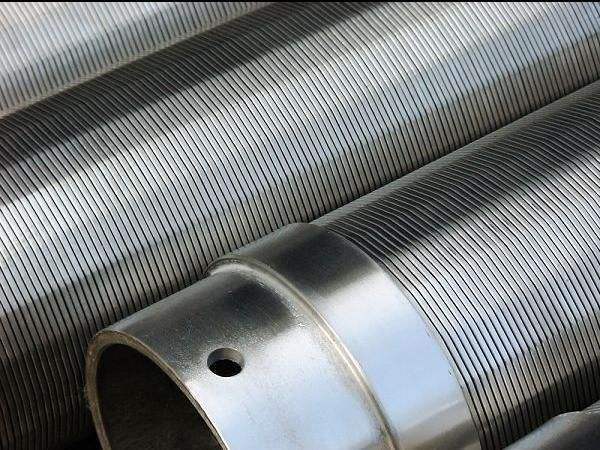
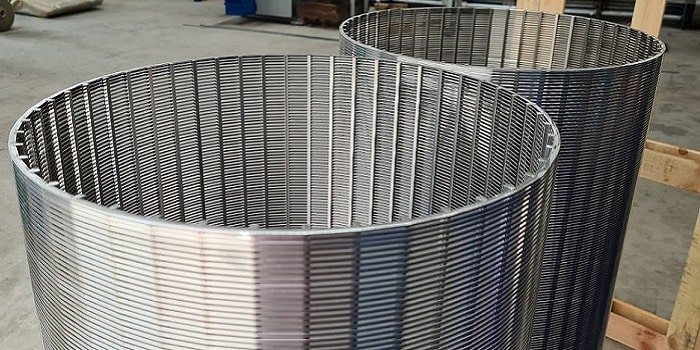
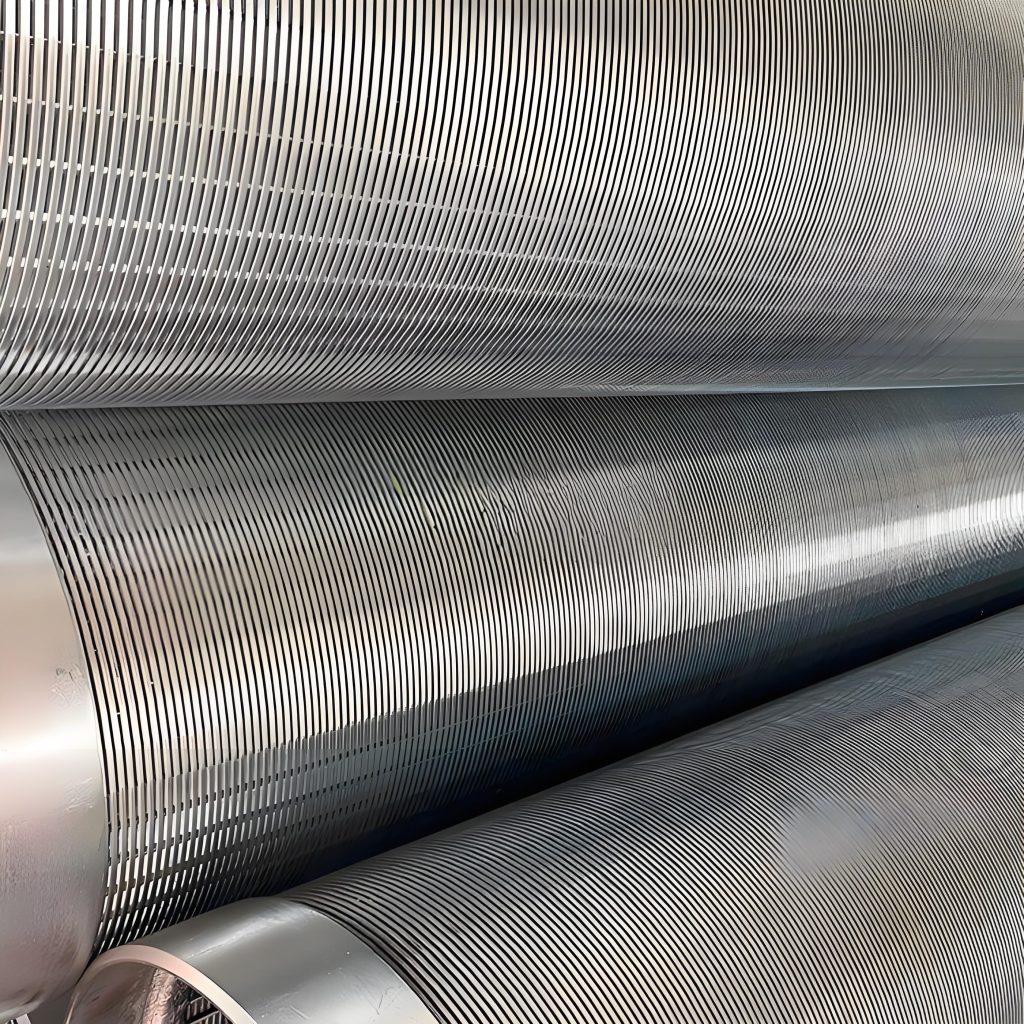
To understand the microscopic damage mechanism of a woven wire mesh, one must think like the fluid. Imagine a high-velocity brine solution, saturated with angular quartz particles, surging through the tortuous paths of a Dutch Weave or a Twilled Square mesh. As these particles approach the wire surface, they don’t just “hit” it; they execute a series of high-frequency micro-impacts that strip away the passive chromium oxide layer of the stainless steel.
This is where the tragedy begins. The moment the passive film is breached, the underlying iron is exposed to the corrosive wellbore environment. We aren’t just looking at mechanical erosion; we are witnessing a synergistic “Erosion-Corrosion” cycle. The mechanical strike removes the protection, the chemical environment pits the surface, and the subsequent strike removes the weakened corrosion product, deepening the crater.
Quantitative Parameters of the Micro-Damage Environment
In our research and production testing, we simulate the extreme conditions of the borehole to map the limits of S316L and S304L woven structures. The following table illustrates the critical variables that dictate the rate of microscopic damage in a sand-control environment.
Table 1: Experimental Parameters for Erosion-Corrosion Sensitivity
| Parameter | Unit | Value Range (Test Standards) | Impact on Micro-Damage |
| Particle Velocity ($V_p$) | m/s | 5.0 – 45.0 | Kinetic energy $E_k \propto V^2$; governs crater depth |
| Impact Angle ($\alpha$) | degrees | 15° – 90° | 30° maximizes cutting; 90° maximizes fatigue |
| Sand Concentration | wt% | 0.5% – 15% | Governs impact frequency and clogging rate |
| Particle Hardness | Mohs | 6.5 – 7.5 (Quartz) | Higher hardness leads to plastic deformation |
| Mesh Aperture (Slot) | μm | 50 – 500 | Determines bridge formation and pore clogging |
The Mechanism of Clogging: The Prelude to Failure
Clogging (or plugging) is often the precursor to erosion. When the particle size distribution (PSD) of the formation sand interacts with the mesh, we observe the formation of a “sand bridge.” If the bridge is stable, the screen functions perfectly. However, if the fluid velocity increases, the bridge becomes a localized nozzle.
As the effective flow area ($A_e$) decreases due to partial plugging, the localized flow velocity through the remaining open pores increases exponentially. According to Bernoulli’s principle and the continuity equation, a 50% reduction in open area can lead to a four-fold increase in the kinetic energy of the striking particles. This “Self-Accelerating Damage” is the reason why a screen that looks fine on day 100 can fail catastrophically by day 105.
Micro-Damage Morphology: Cutting vs. Deformation
When we analyze the failed wire mesh under Scanning Electron Microscopy (SEM), we categorize the damage into two primary modes:
- Micro-Cutting (The 30° Problem): At low impact angles, angular sand grains act like tiny lathe tools. They peel away thin ribbons of the stainless steel wire. This reduces the wire diameter, weakening the structural integrity of the weave.
- Repeated Deformation / Fatigue (The 90° Problem): At high impact angles, the kinetic energy is absorbed by the wire as plastic deformation. The surface becomes work-hardened and brittle. Over millions of cycles, micro-cracks propagate along the grain boundaries of the austenite structure, eventually leading to “wire snapping.”
Material Science: The Alloy’s Last Stand
Our manufacturing philosophy is rooted in the “Pre-Stressing” of the weave. By using a vacuum annealing process after the wire is woven, we reduce the residual stresses that act as “magnifiers” for erosion damage. Furthermore, the chemical composition of our mesh is strictly controlled to maximize the Pitting Resistance Equivalent Number (PREN).
A higher PREN ensures that even when the sand strikes the wire, the rate of chemical “re-passivation” (the healing of the oxide layer) is faster than the rate of mechanical removal. For high-CO2 and H2S environments, our S31603 (316L) mesh with a Mo content > 2.0% is the baseline requirement to prevent the microscopic pitting that often serves as the “niche” for sand grain anchoring and subsequent clogging.
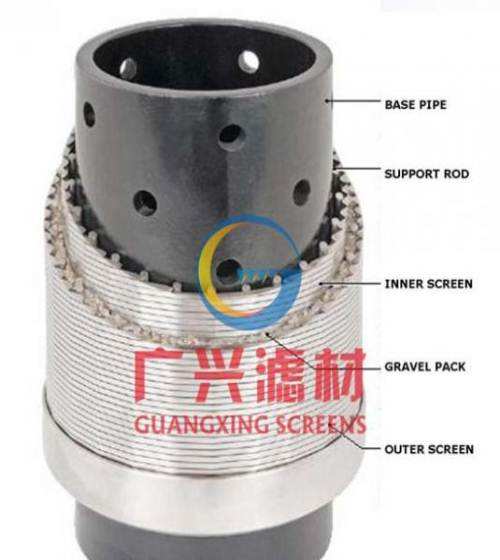
Integrated Structural Engineering: Why Our Screens Endure
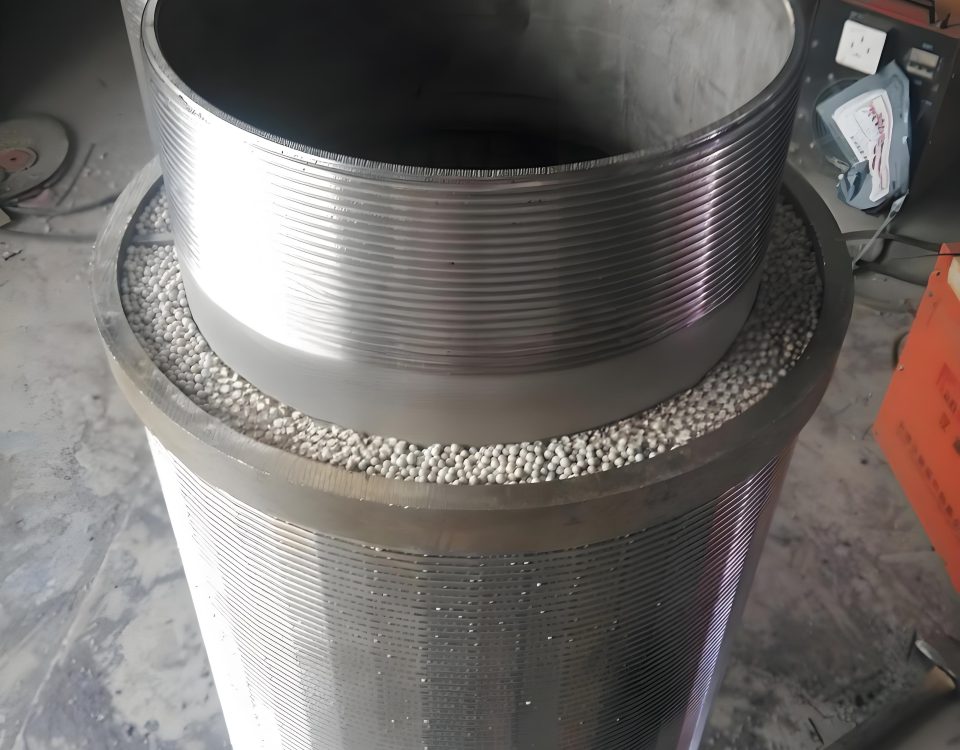
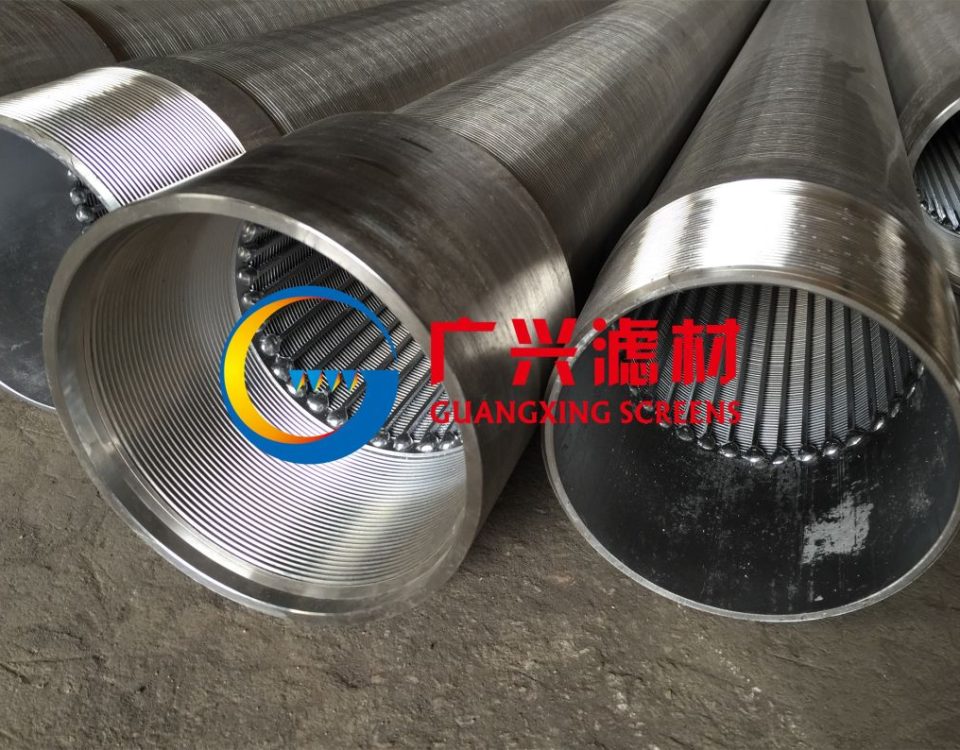
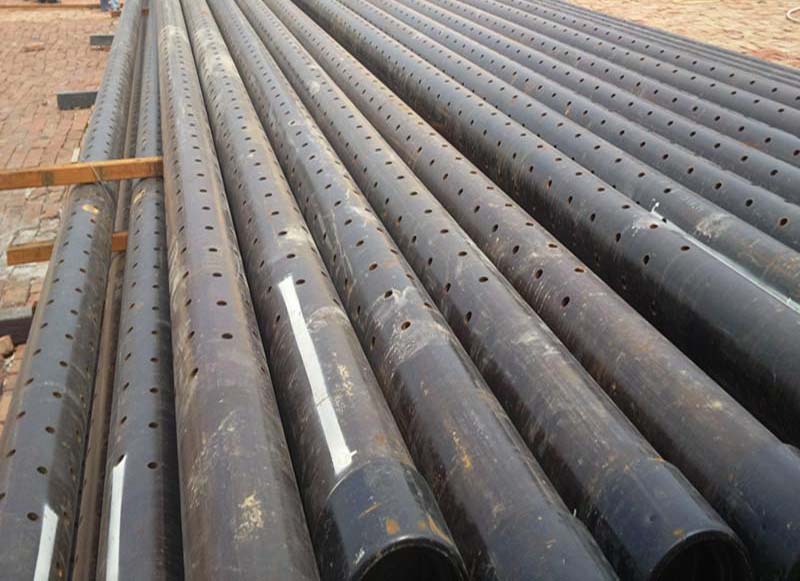
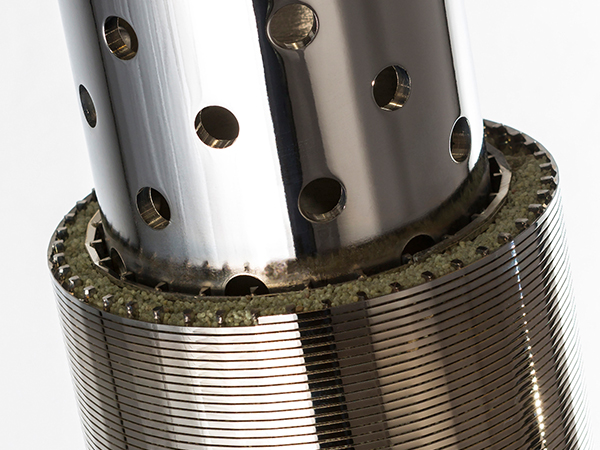
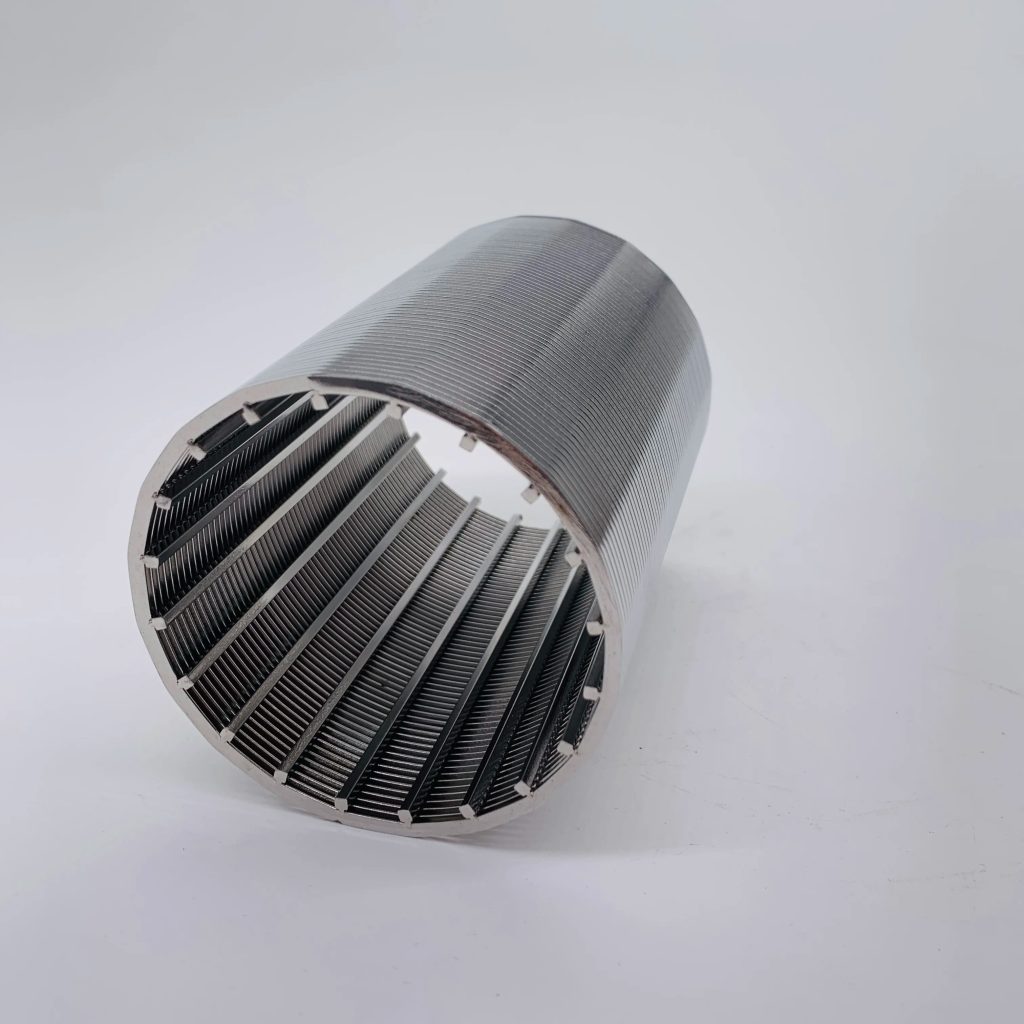
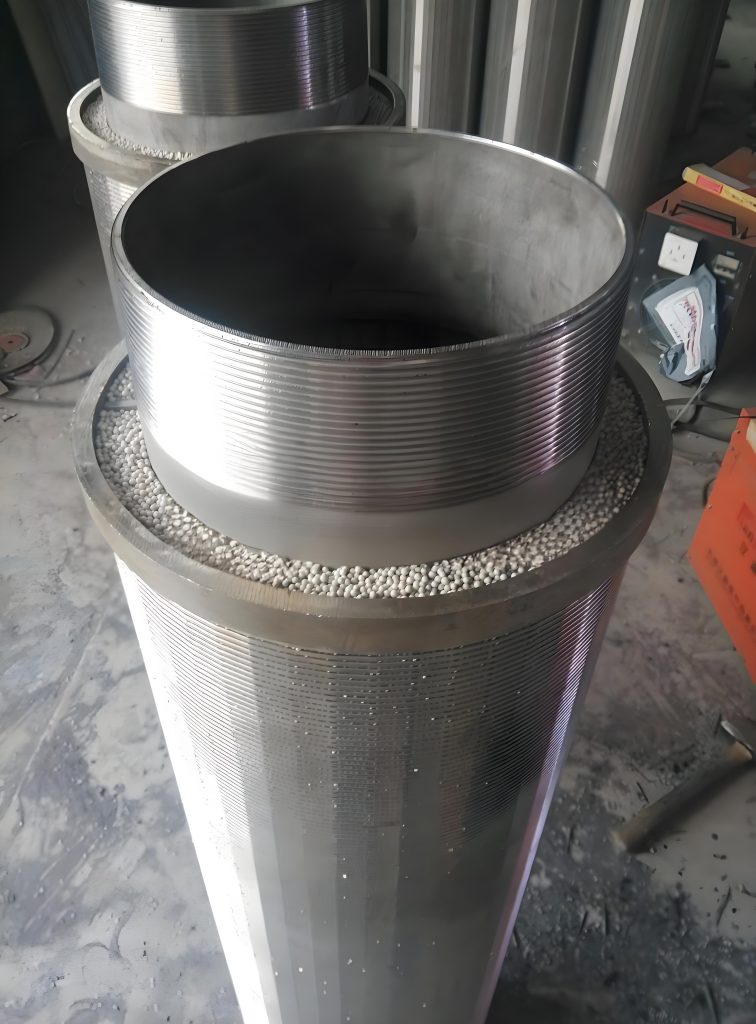
The technical analysis of sand-control screens must move from a 2D view to a 3D structural view. We don’t just provide a mesh; we provide a “Composite Filtration Layer.” This typically involves:
- The Protective Outer Shroud: Taking the brunt of the high-velocity flow and diffusing the kinetic energy.
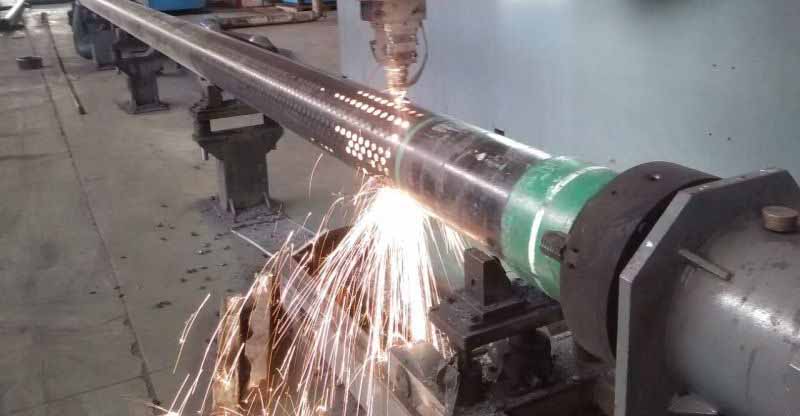
- The Primary Filter Mesh: Precision-woven to the formation $D_{50}$ or $D_{10}$ requirements.
- The Drainage Layer: Ensuring that once a particle passes the mesh, it is cleared away immediately, preventing internal “silt-up.”
By controlling the “Weave Tightness,” we ensure that the support rods and the filter wire act as a single unit. In our tests, this integrated approach reduces the vibration of individual wires, which is a major, yet often ignored, cause of fatigue-induced pore enlargement.
Summary of Scientific Findings
The research into micro-damage mechanisms teaches us that “Hardness” is not the only answer. A screen must be Tough (to absorb energy) and Chemically Reactive (to heal its skin). The synergy between the flow dynamics (Table 1) and the metallurgical properties (PREN) determines the economic success of the well.
Our company stands at the forefront of this microscopic battlefield. We don’t just sell wire; we sell the result of thousands of hours of erosion-corrosion modeling. When your completion project faces the abrasive reality of a high-rate gas well or a horizontal oil well, our technical depth ensures that your filter remains a barrier, not a point of failure.
To provide a rigorous scientific prediction of the service life of a sand-control screen, we must integrate the mechanical wear laws with the stochastic nature of particle impingement. Predicting the failure of a woven mesh is essentially a race between the Critical Wall Loss of the wire and the Pore Enlargement Ratio.
The Mathematical Framework of Service Life Prediction
Our predictive model utilizes a modified version of the Finnie Erosion Equation, adapted specifically for the slender geometry of woven wires in a submerged fluid environment. The volume of material removed ($V$) per unit mass of erodent is calculated as follows:
Where:
- $m$: Mass of the impinging sand grains.
- $v$: Localized velocity (magnified by the clogging factor).
- $p$: Flow stress of the stainless steel (e.g., S316L).
- $\alpha$: The impingement angle.
- $\psi, \phi, q$: Constants derived from our empirical laboratory testing of woven structures.
In our internal monologue of engineering design, we don’t just look at the average velocity. We must account for the Velocity Concentration Factor ($\xi$). As sand accumulates in certain zones of the mesh, the “effective” velocity through the remaining open pores can increase by a factor of 3 to 5, leading to a non-linear acceleration of damage.
Quantitative Correlation: Erosion Rate vs. Fluid Dynamics
Based on our high-velocity slurry loop tests, we have mapped the relationship between fluid parameters and the micro-mechanical damage of the mesh.
Table 2: Simulated Service Life & Erosion Depth Correlation
| Fluid Velocity (m/s) | Sand Concentration (ppm) | Measured Erosion Rate (mm/year) | Predicted Mesh Life (Months) | Failure Mode |
| 0.5 | 500 | 0.012 | 120+ | Negligible wear |
| 2.0 | 2,000 | 0.085 | 48 | Pitting/Clogging |
| 5.0 | 5,000 | 0.420 | 14 | Wire Thinning |
| 12.0 | 10,000 | 1.850 | 3 | Breakthrough |
The Microscopic Mechanism of “Breakthrough”
Failure occurs when the wire diameter ($d$) is reduced to a critical threshold where it can no longer withstand the Differential Pressure ($\Delta P$) across the screen.
For a woven mesh, the “Pore Stability Factor” ($S_p$) is defined as:
Once $S_p$ falls below a critical value (typically 0.4 for S316L), the wires undergo a localized buckling or “shunting” effect. The pore size suddenly increases from, for example, 150μm to 400μm. This is the Breakthrough Point. At this moment, the screen ceases to be a filter and becomes a gateway for formation destruction.
Engineering Strategy: Extending the “Safe Zone”
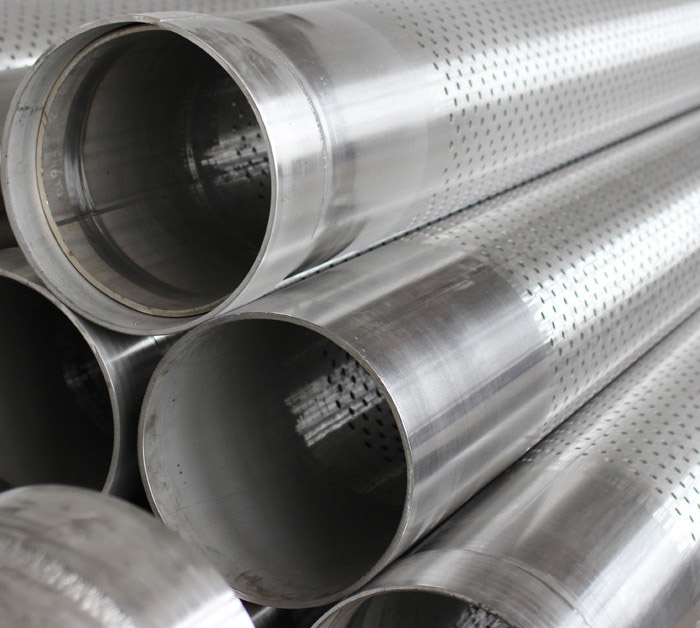
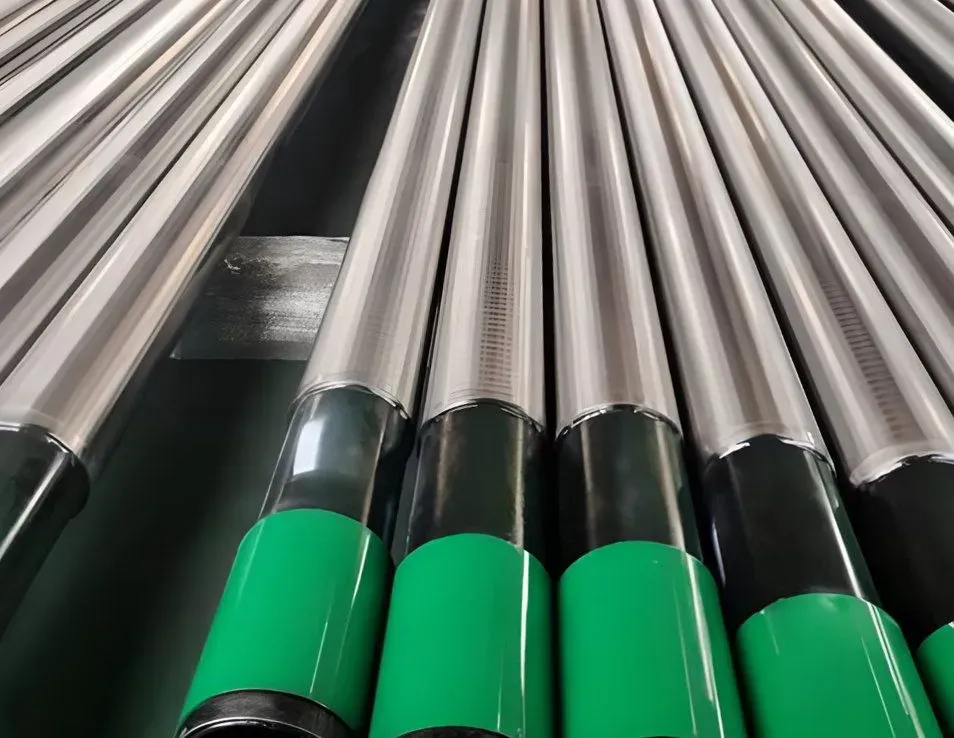
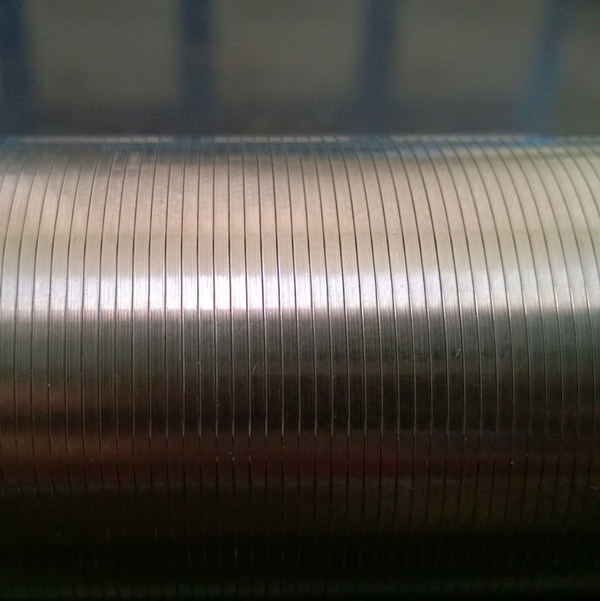
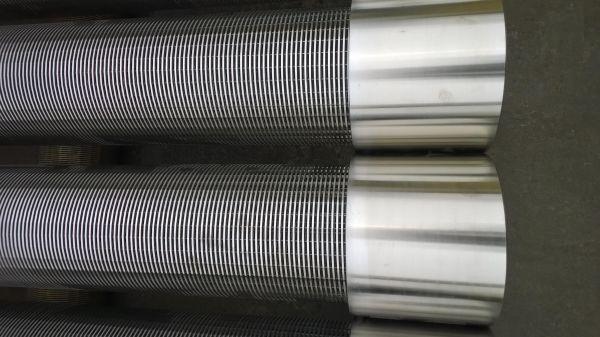
Our company’s high-performance sand screens are designed with an “Erosion Allowance.” By utilizing a Heavy-Duty Calendered Mesh, we achieve several technical advantages:
- Work Hardening: The calendering process increases the surface hardness of the wires, raising the value of $p$ (flow stress) in our erosion equation.
- Geometry Flattening: A flatter wire profile reduces the “Stagnation Point” of the fluid, encouraging particles to slide over the surface rather than striking it at high-impact angles.
- Redundant Weaving: We utilize a “Multi-Layer Sintered” approach where a secondary sacrificial mesh protects the primary filtration layer, effectively doubling the predicted service life in high-velocity gas wells.
Why Choose Our Scientific Approach?
Most suppliers provide a screen based on a static slot size. We provide a Dynamic Performance Guarantee. Our technical proposal for your project will include:
- CFD (Computational Fluid Dynamics) Modeling: To identify “Hot Spots” in the wellbore where erosion will be most severe.
- Material Selection Optimization: A cost-benefit analysis between SS304L, SS316L, and Duplex steels based on your specific $H_2S$ and Chloride levels.
- Development Planning: Guidance on initial well “drawdown” rates to allow for the formation of a stable, protective sand bridge that minimizes long-term erosion.
In the science of sand control, the most expensive screen is the one that fails prematurely. Our S316L woven screens are engineered not just to fit the hole, but to survive the flow.

