

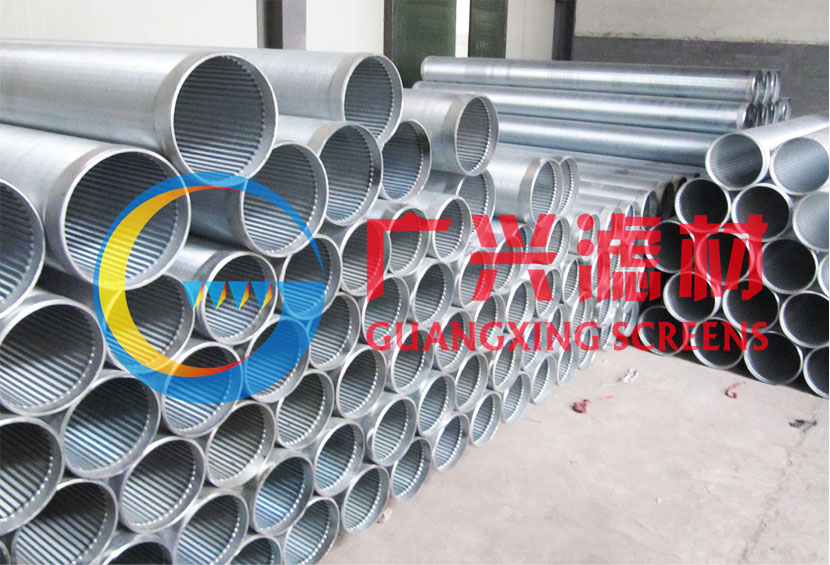
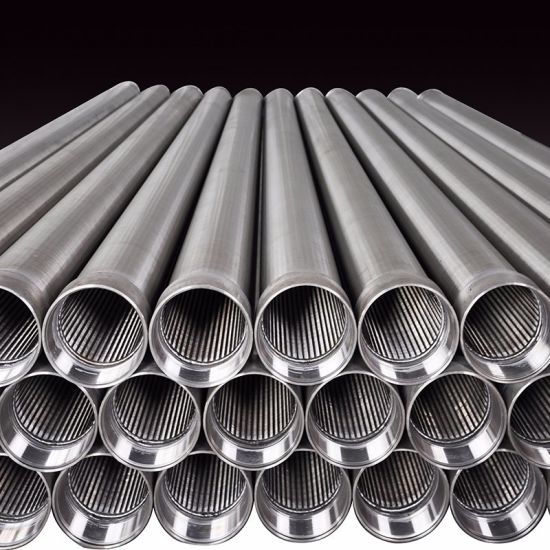
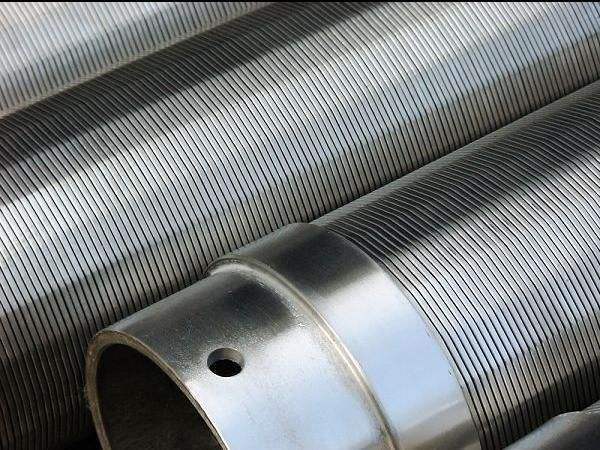
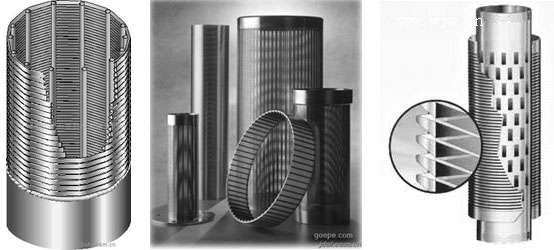
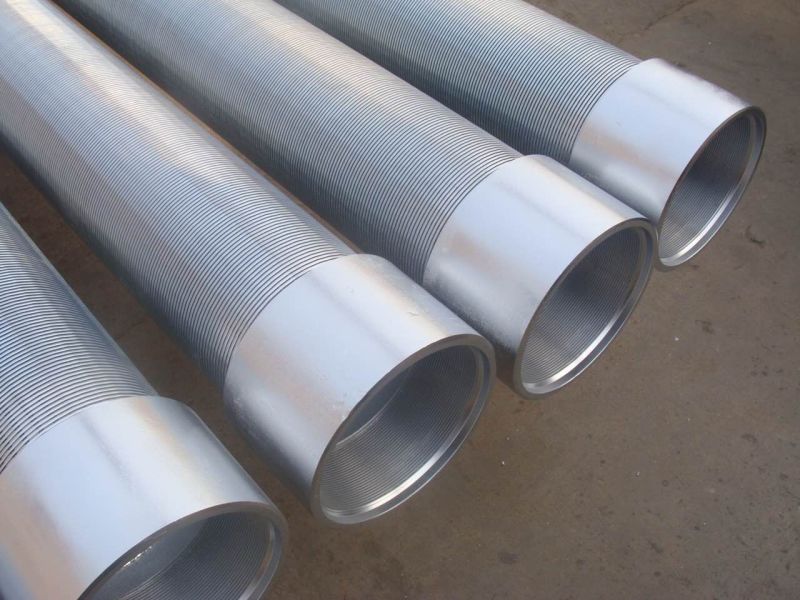
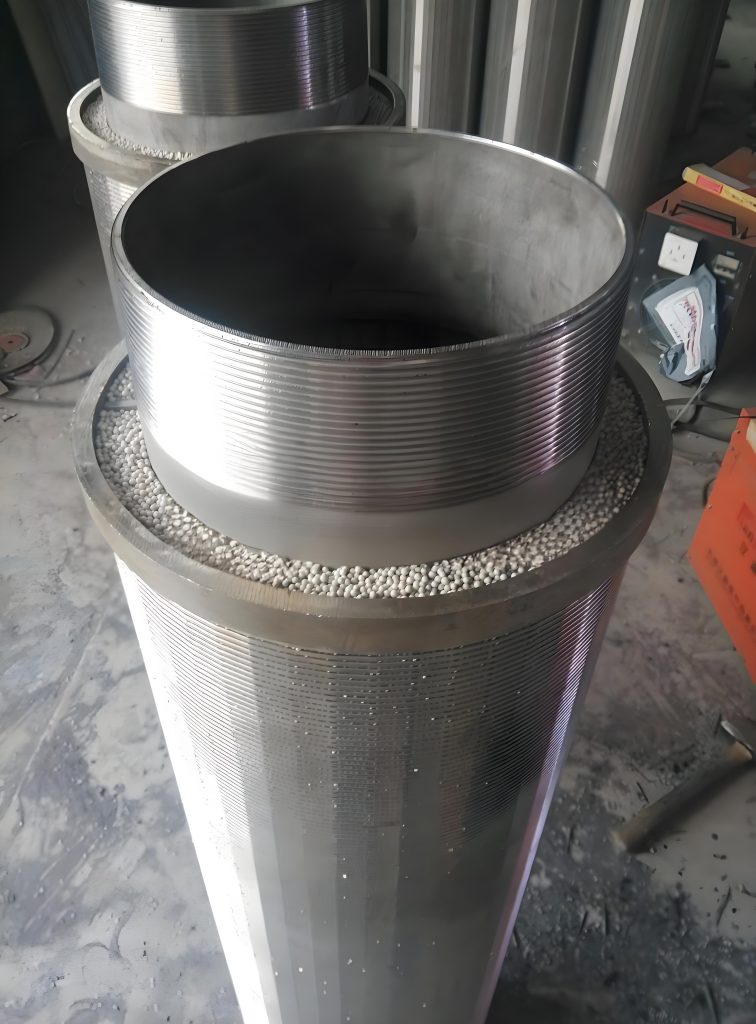
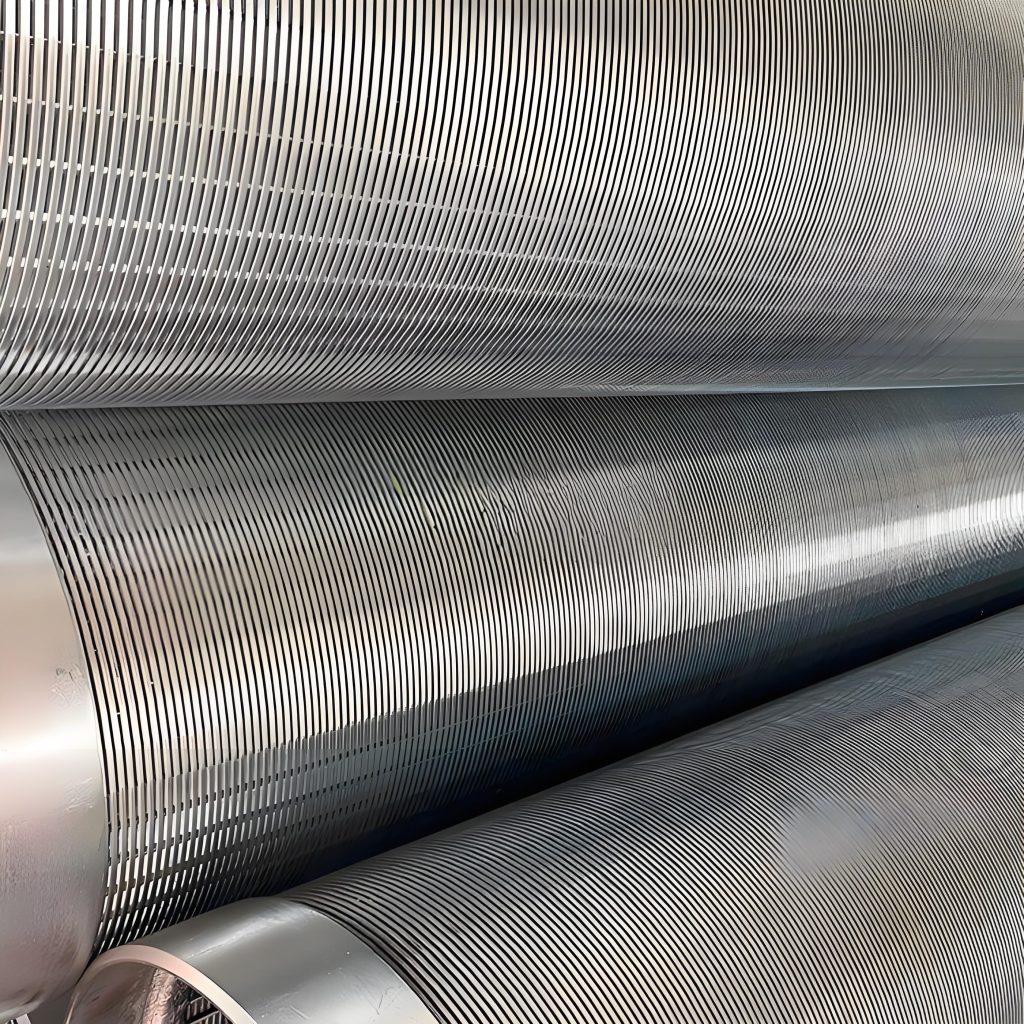
Vee-Wire Filter Screen System – Designing an Anti-Clogging Well Screen
November 22, 2025
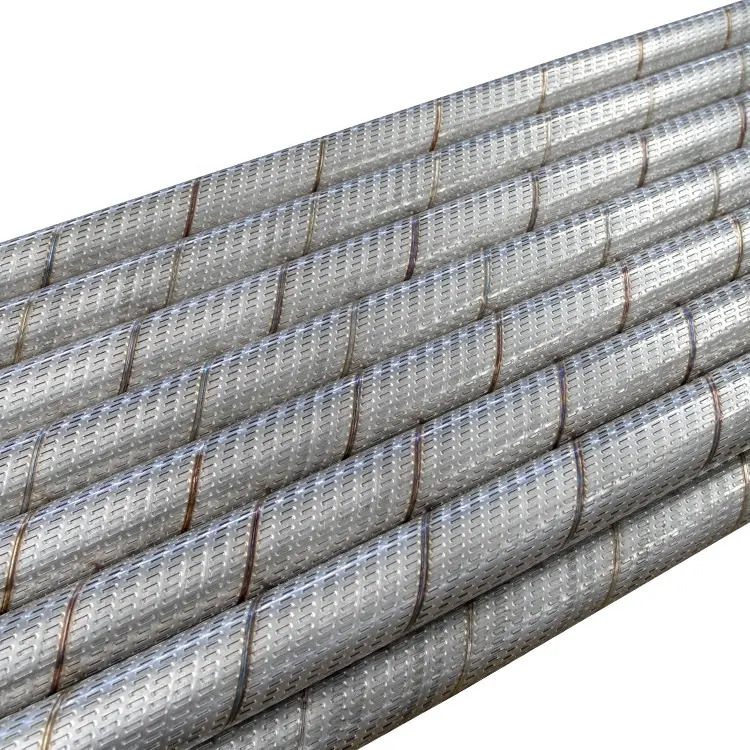
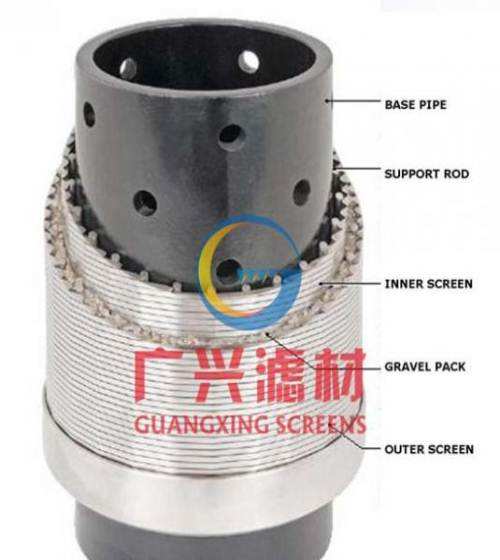
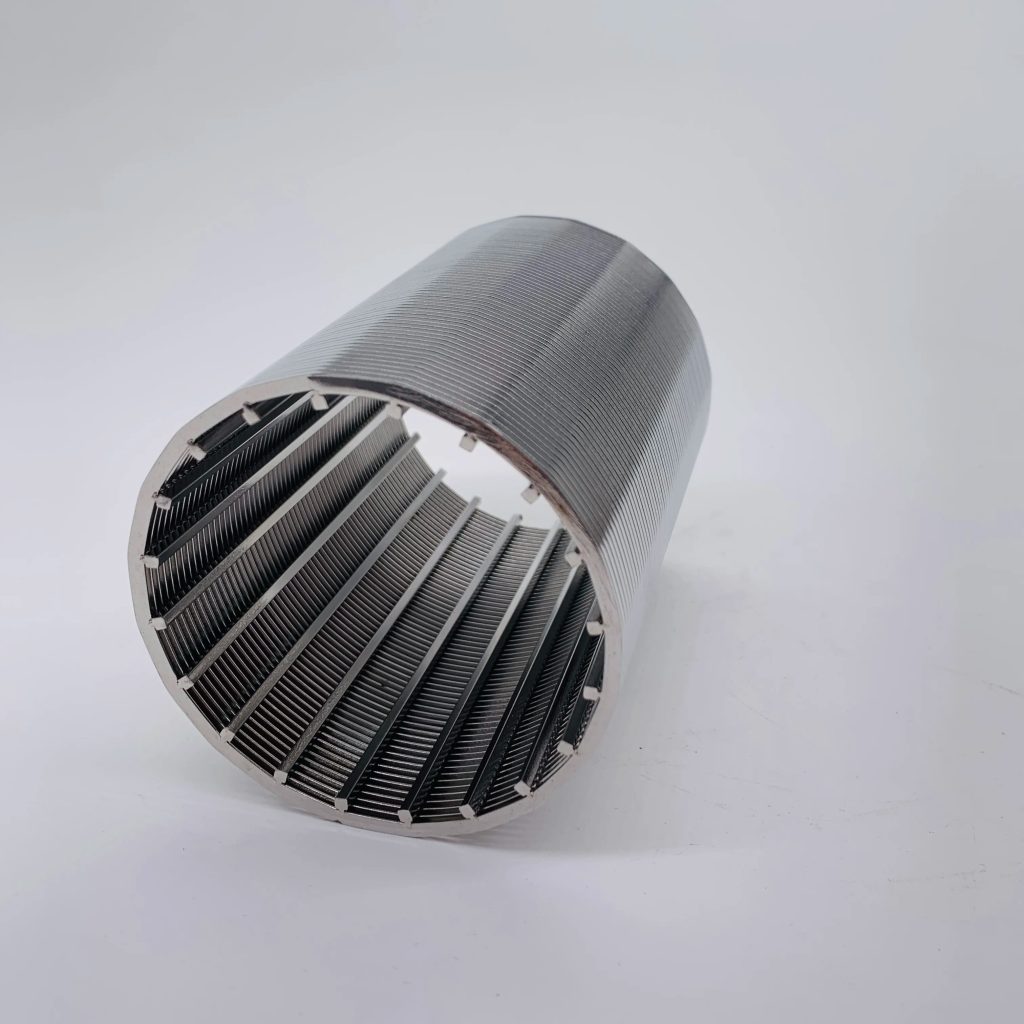
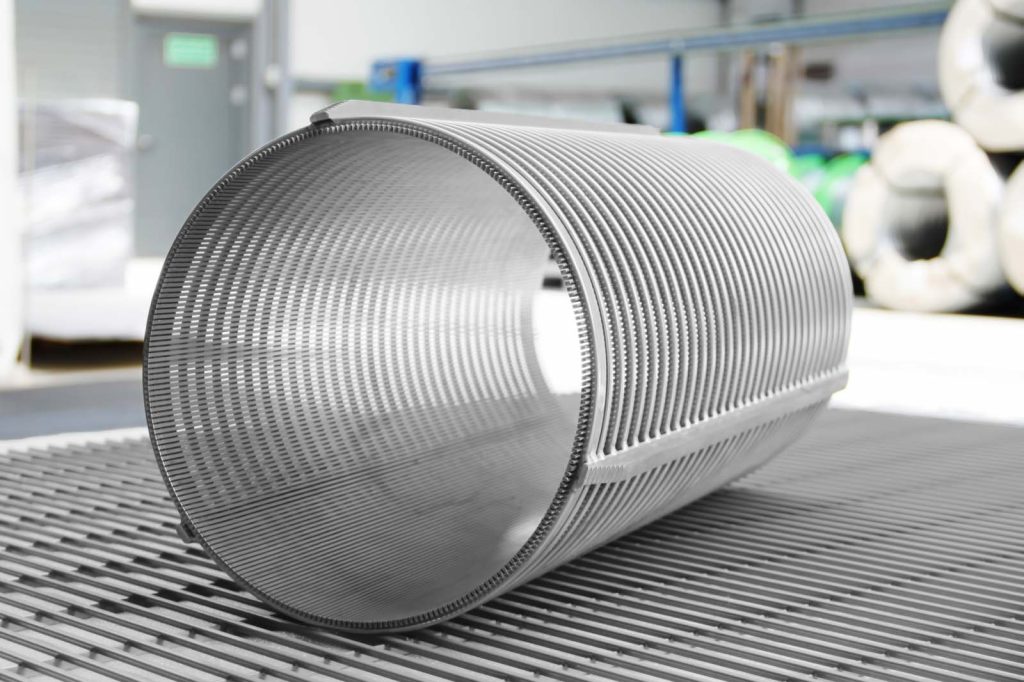
Ultra-Resilient Dual-Layer Gravel Pack Screen
December 10, 2025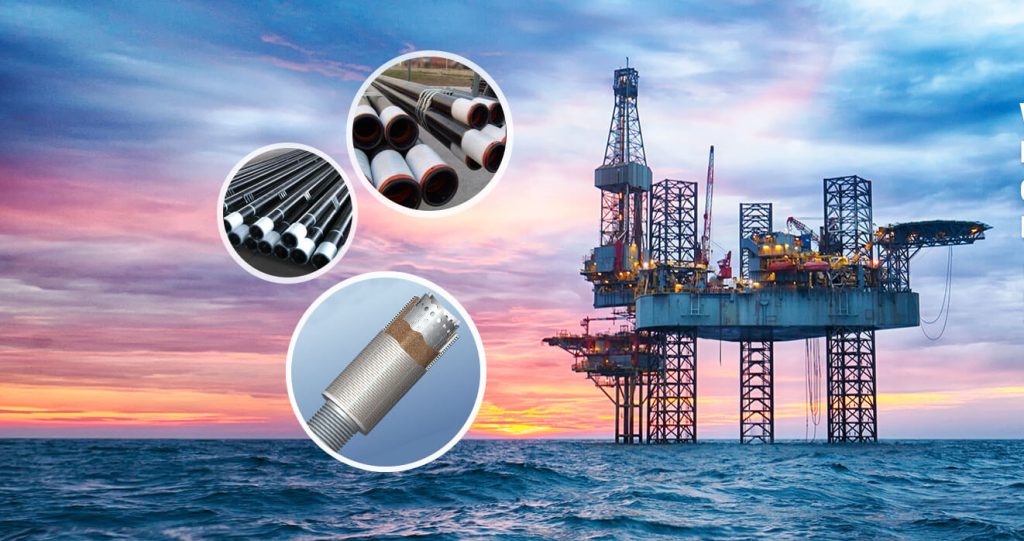
The Hydrodynamic and Economic Nexus: Analyzing the Impact of Well Screen Diameter on Horizontal Gas Well Productivity
The exploitation of natural gas from reservoirs requiring sand control—typically unconsolidated or weakly cemented formations—necessitates the deployment of specialized filtration devices, most commonly the high-performance Wedge-Wire (Vee-Wire) screen. While the screen successfully mitigates the catastrophic risk of formation collapse and equipment damage, its physical dimension, specifically its inner diameter ($D_i$), introduces a complex multi-physics constraint on the well’s ultimate productivity. Determining the optimal screen diameter in a long horizontal gas well is not merely a geometric exercise; it is an intricate economic and hydrodynamic optimization problem that requires the rigorous coupling of three-dimensional reservoir inflow with the highly frictional two-phase outflow within the wellbore. Conventional simplistic models, which assume uniform pressure along the lateral or negligible flow resistance, catastrophically fail in high-rate gas environments where the inherent compressibility and velocity of the fluid exacerbate frictional energy dissipation.
The analytical pathway to resolving this challenge lies in the deployment of Nodal Analysis (NA), a powerful systems engineering approach that allows for the simultaneous modeling of reservoir deliverability (Inflow Performance Relationship, IPR) and wellbore transport efficiency (Outflow Performance Relationship, OPR). By adapting the NA framework to account for the unique pressure gradient profile characteristic of a long horizontal gas well completed with a slotted or screened liner, engineers can precisely calculate the well’s expected productivity for varying screen pipe diameters. Ultimately, this detailed hydraulic calculation is synthesized with capital expenditure (CAPEX) data—specifically the cost of the screen itself—and projected gas revenue to pinpoint the financially optimal screen diameter that maximizes the lifetime Net Present Value (NPV) of the asset. This entire integrated methodology provides a robust, field-validated approach to mitigating the inherent uncertainties of complex horizontal well completions.
1. The Horizontal Gas Well Conundrum: The Velocity and Volume Constraint
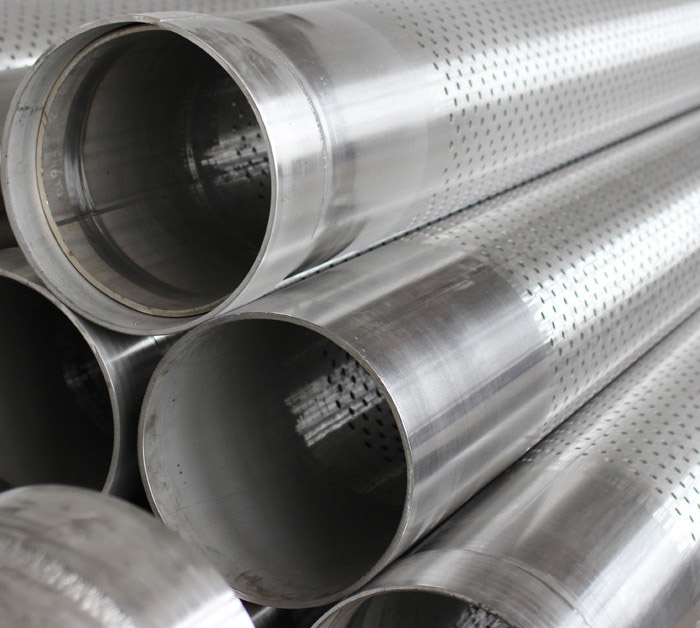
Horizontal wells are the mainstay of modern gas production, exposing long intervals of the reservoir to the wellbore and thereby maximizing gas flow. However, the requirement for sand control in weakly consolidated gas formations forces the installation of a screen, usually jacketed by an annular gravel pack. The screen, while necessary, effectively reduces the diameter of the primary flow conduit compared to an open hole completion, compelling the high-velocity gas to travel through a smaller annulus. In gas production, this size reduction leads directly to the core analytical challenge: the relationship between high fluid velocity and frictional pressure drop.
The Physics of Frictional Loss in Gas Flow
Unlike liquid flow, where fluid density and viscosity remain relatively constant, gas flow is highly sensitive to pressure and velocity changes. The volumetric flow rate ($q_v$) of gas dramatically increases as pressure decreases. Since the flow is predominantly unidirectional along the long horizontal section, the total flow rate progressively accumulates toward the heel (the end closest to the vertical section). Consequently, the fluid velocity ($v$) is highest at the heel, where the pressure is lowest, creating a significant and often dominant frictional pressure gradient ($\Delta P_f / \Delta L$).
This frictional loss means that the pressure inside the screen decreases substantially from the toe (the far end) to the heel. This pressure difference is the fundamental mechanism that dictates the non-uniform flow contribution along the lateral: the heel experiences the highest wellbore pressure drop and thus the lowest reservoir drawdown, contributing less flow than the toe. This phenomenon, known as the “heel-to-toe effect,” is the primary driver behind the sub-optimal performance of long horizontal gas wells.
The screen’s internal diameter ($D_i$) is the key variable controlling this effect: a smaller $D_i$ results in higher gas velocity ($v \propto 1/D_i^2$) and, crucially, frictional pressure loss ($\Delta P_f \propto v^2$), creating a steeper pressure drop gradient and thus a more severe heel-to-toe effect, significantly limiting total well productivity. The engineering challenge is, therefore, to model this complex flow coupling accurately.
2. Modeling the Inflow Performance Relationship (IPR) in 3D
The first stage of the Nodal Analysis is the accurate representation of the reservoir’s ability to deliver gas into the wellbore—the IPR. For a long horizontal well, this is significantly more complex than the simple radial flow model used for vertical wells. The flow geometry involves a three-dimensional superposition of flow regimes.
3D Flow Geometry and Non-Darcy Effects
Near the horizontal wellbore, flow is predominantly radial, converging toward the screen. At greater distances from the well, flow is increasingly linear or elliptical, converging toward the horizontal plane. Analytical models, such as those derived by Joshi or specialized boundary-element methods, must integrate these components to determine the I pressure required to deliver a certain flow rate from the reservoir into the horizontal section. The standard assumption of uniform pressure along the lateral is inherently erroneous because it fails to account for the frictional losses described above. Instead, the IPR must be calculated segmentally along the length ($L$) of the well.
Crucially, gas flow in high-rate reservoirs is subject to Non-Darcy Flow effects—a pressure loss component caused by turbulence and high inertial forces near the wellbore. The traditional Darcy model (linear relationship between rate and pressure drop) is insufficient. The real pressure drop is described by the Forchheimer Equation, which includes a velocity-squared term:
where $a$ represents the viscous (Darcy) term and $b Q^2$ represents the inertial (Non-Darcy) term, where $b$ is the non-Darcy coefficient ($\beta$). In gas wells, this Non-Darcy effect is frequently magnified by the completion hardware itself. The flow of gas from the formation, through the highly restricted apertures of the gravel pack and the wedge-wire screen slots, creates intense localized turbulence and momentum loss, significantly increasing the pressure drop at the sand-face ($\Delta P_{skin}$). This is a high-magnitude pressure drop that directly impacts the IPR calculation and must be integrated into the overall skin factor.
The total reservoir deliverability ($Q_{reservoir}$) is the sum of the flow rates from all discrete segments along the horizontal length, with each segment’s contribution dependent on its local drawdown, which is determined by the pressure inside the screen at that specific segment location.
3. Analyzing Outflow Performance (OPR) and Frictional Losses
The Outflow Performance Relationship (OPR) models the pressure required to transport the accumulated gas volume from the toe to the heel and up the tubing to the surface. For the purpose of optimizing the screen diameter, the most critical component of the OPR is the Pressure Gradient inside the Horizontal Screen ($P_{screen}$). The pressure change ($\Delta P$) along any segment of the horizontal screen of length $\Delta L$ is the sum of three distinct, non-linear components:
The Dominant Term: Frictional Pressure Loss ($\Delta P_{friction}$)
The frictional pressure drop ($\Delta P_{friction}$) is the largest term, directly proportional to the length of the segment, the square of the mass velocity, and the Fanning Friction Factor ($f_f$):
Herein lies the direct physical link to the screen diameter ($D_i$). Since velocity ($v$) is inversely proportional to the square of the internal diameter ($D_i^2$), a modest reduction in $D_i$ can lead to a drastic, non-linear increase in the frictional pressure loss.
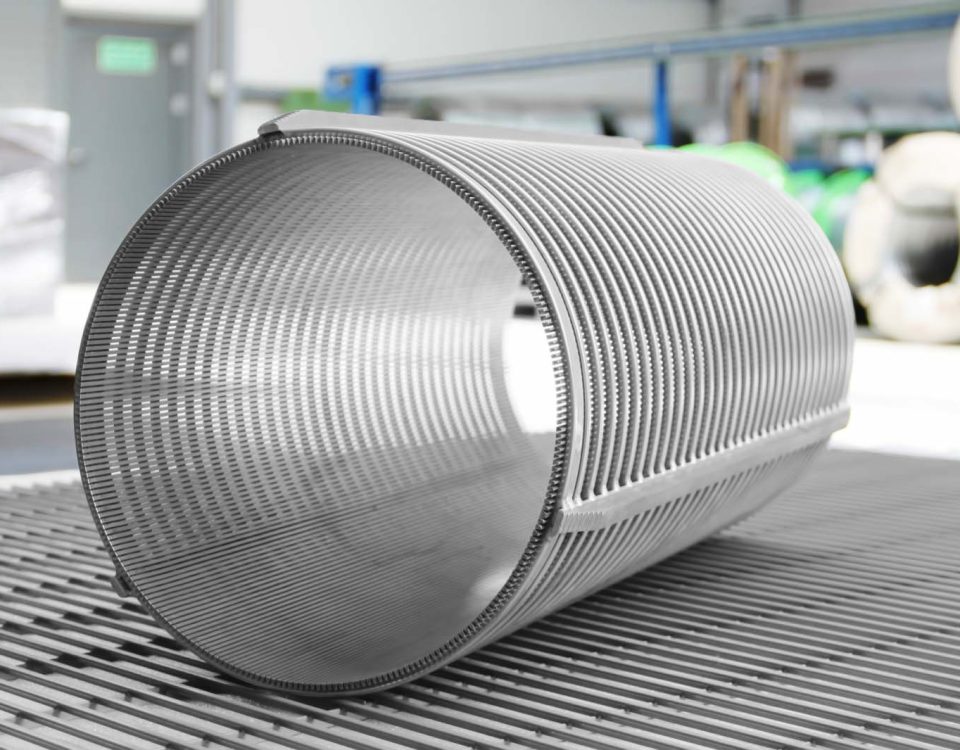
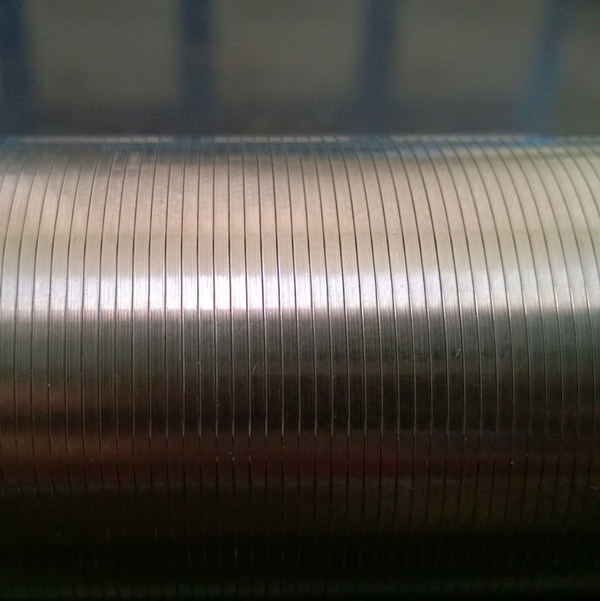
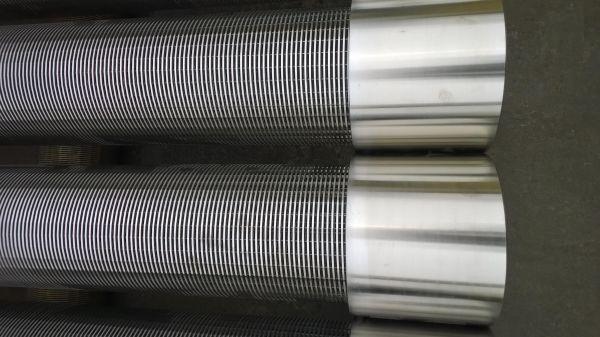
Furthermore, the friction factor ($f_f$) itself is not constant. It is influenced by the internal roughness ($\epsilon$) of the flow path. The internal surface of a standard carbon steel pipe is relatively smooth. However, a Wedge-Wire screen is inherently rougher due to the presence of the internal support rods, the edges of the Vee-Wire wraps, and the small gaps between the wires and the base pipe. The friction factor must therefore be adjusted—using generalized correlations derived from the Moody chart for rough conduits—to accurately represent the enhanced wall shear stress inside the screened section. This adjustment ensures that the modeled pressure drop is reflective of the actual physical constraints of the sand control hardware.
Other Contributing Terms: Acceleration and Coupling Losses
-
Acceleration Pressure Loss ($\Delta P_{acceleration}$): In gas flow, as pressure decreases along the length, the gas density ($\rho$) also decreases. For mass continuity, the velocity must increase (acceleration). This acceleration requires energy and results in a pressure drop, contributing a secondary loss term, which is particularly significant in the heel section where the greatest pressure reduction occurs.
-
Flow Coupling Pressure Loss ($\Delta P_{coupling}$): As fluid enters the screen from the reservoir, it transitions from radial to axial flow, resulting in a sudden change in momentum and direction. This entry turbulence causes an associated momentum pressure loss ($\Delta P_{a}$), often modeled using an empirical coefficient that accounts for the geometry and open area of the screen slots. While localized, this loss is critical as it dictates the effective inflow efficiency at the reservoir interface.
The Nodal Analysis framework must be designed to calculate these three terms iteratively for every small segment ($\Delta L$) along the horizontal length, starting from the known pressure at the toe and accumulating the pressure losses up to the heel, thereby generating the true, non-linear Wellbore Pressure Profile.
4. The Integrated Nodal Analysis and Economic Optimization
The power of Nodal Analysis is its ability to find the single operating point that satisfies both the reservoir’s capacity (IPR) and the wellbore’s capability (OPR) simultaneously. For the horizontal gas well, this synthesis is achieved segmentally.
The Iterative Segmental Coupling
The coupled model solves for the equilibrium flow rate at each segment ($\Delta L$) by iterating until the calculated flow rate into the screen segment from the reservoir equals the axial flow rate carried away by the wellbore.
-
Start at the Toe: Assume a pressure ($P_{toe}$) at the far end of the screen.
-
Calculate IPR for Segment 1: Determine the flow rate ($Q_1$) contributed by the reservoir into segment 1, based on the assumed $P_{toe}$ and the reservoir pressure.
-
Calculate $\Delta P$ for Segment 1: Use $Q_1$ to calculate the total pressure drop ($\Delta P_{total}$) across the screen length $\Delta L$ due to friction, acceleration, and coupling.
-
Determine Pressure for Segment 2: $P_{segment\_2} = P_{toe} + \Delta P_{total}$.
-
Iterate: Repeat the process, using the newly calculated pressure as the starting point for the next segment, accumulating flow and pressure loss until the heel is reached.
This iterative process yields the True Total Production Rate ($Q_{total}$) and the Actual Heel Pressure ($P_{heel}$) for a given screen diameter ($D_s$). The final output is a highly accurate production curve that directly reflects the hydraulic limitations imposed by the chosen $D_s$.
The Economic Synthesis: Maximizing Net Present Value (NPV)
Once the hydraulic model reliably predicts the cumulative production rate ($Q_{total}$) for a range of viable screen diameters (e.g., $4.5 \text{ inch}$ to $6.5 \text{ inch}$), the analysis transitions to the commercial realm—the ultimate goal is to select the diameter that maximizes profitability.
The key variables in the economic analysis are:
-
Revenue Stream (Benefits): The cumulative lifetime gas production associated with each $D_s$ (derived from $Q_{total}$) multiplied by the projected gas price, discounted back to the present day (Present Value of Revenue). A larger $D_s$ generally yields a higher $Q_{total}$ and thus a higher revenue PV.
-
Capital Expenditure (Costs): The cost of the screen material itself, the cost of the gravel pack material (which changes with annulus size), and the installation costs. A larger $D_s$ requires more expensive material per unit length, increasing the CAPEX.
The optimal screen diameter ($D_{opt}$) is the one that maximizes the Net Present Value (NPV):
The analysis highlights the core engineering-economic trade-off: spending more on a larger screen ($D_s$) increases upfront costs but boosts long-term production revenue by mitigating frictional losses. The optimal solution is the precise balance point where the marginal cost of increasing the screen size is precisely offset by the marginal increase in the discounted revenue stream.
5. Validation and Strategic Selection for Horizontal Completions
The derived Nodal Analysis methodology, which couples 3D reservoir flow with non-linear wellbore flow resistance, offers a robust framework for making critical completion decisions. Validation of this complex model is achieved by comparing the predicted IPR for a given field configuration against measured flow tests from wells completed with known screen diameters. The observation that the model’s predictions align closely with actual field application results provides the necessary confidence in its use as a primary design tool.
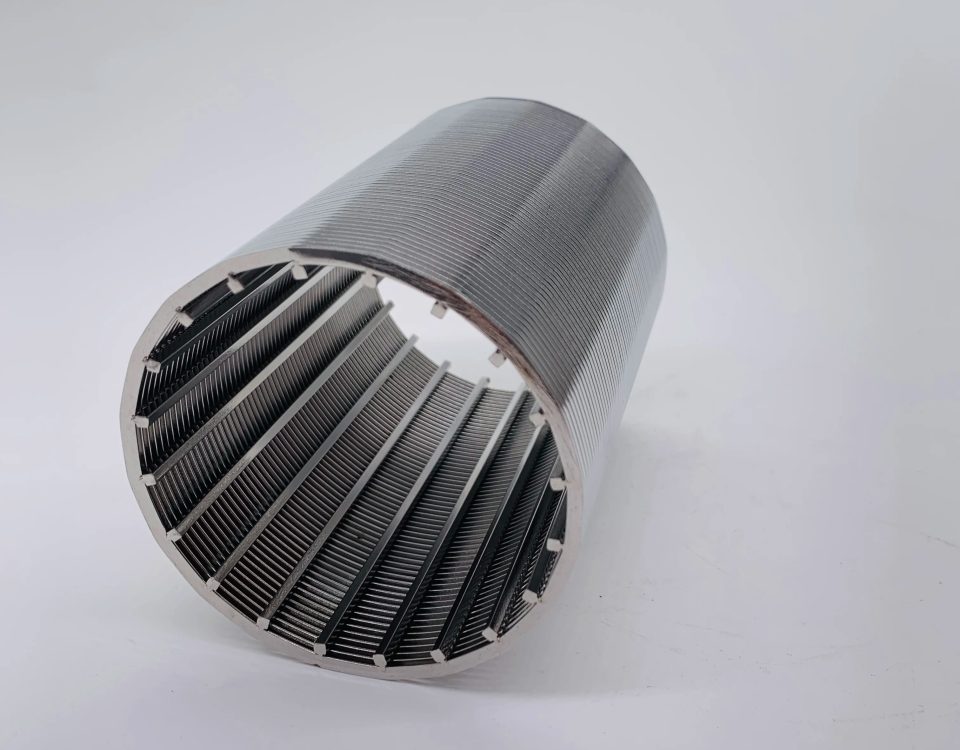
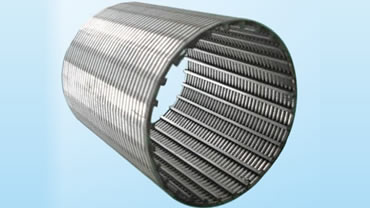
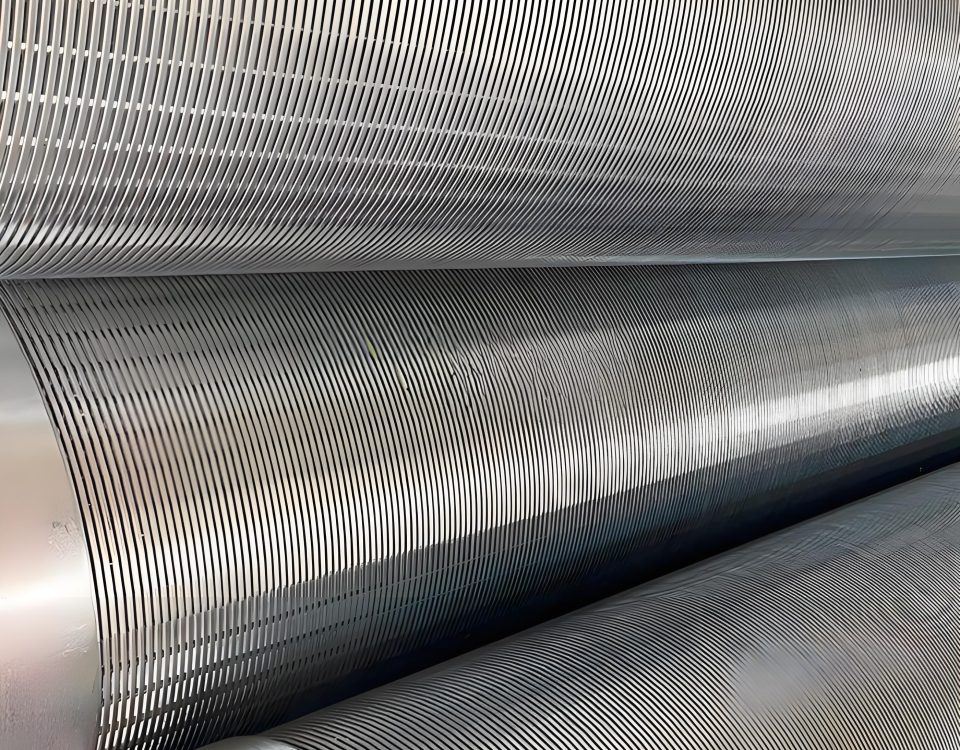
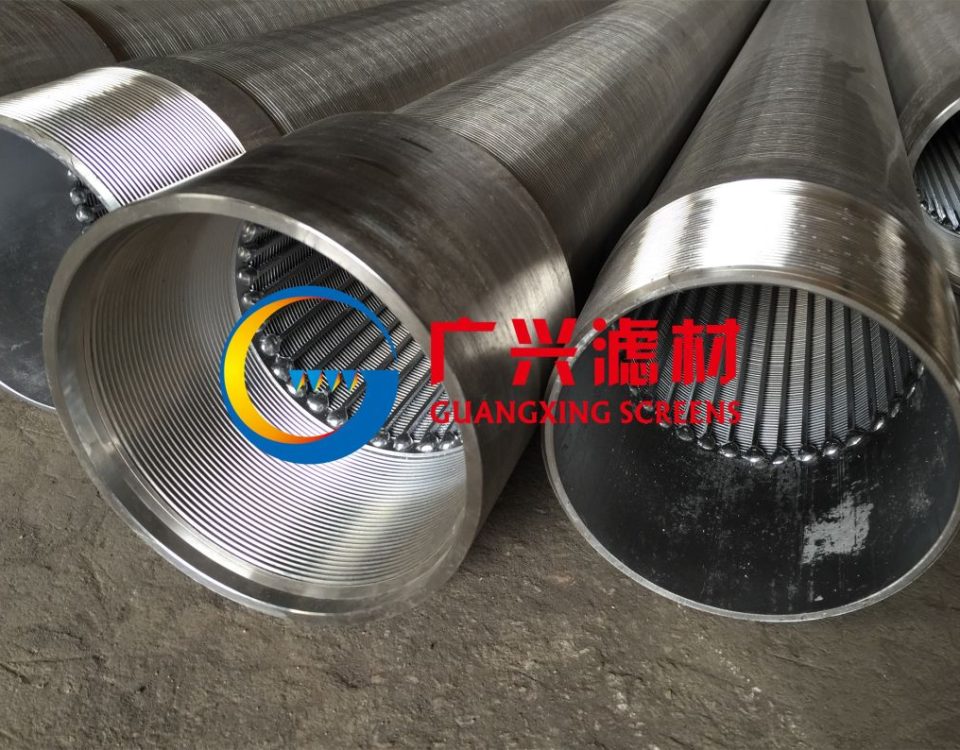
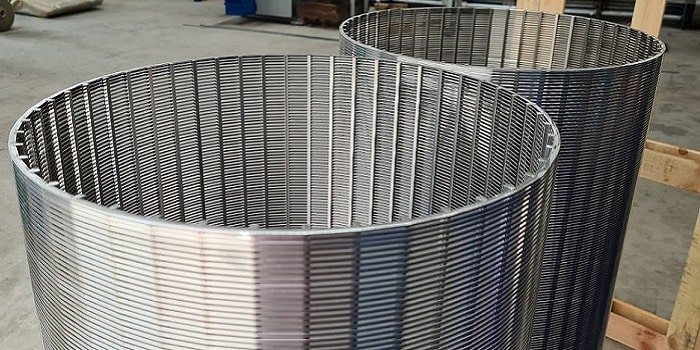
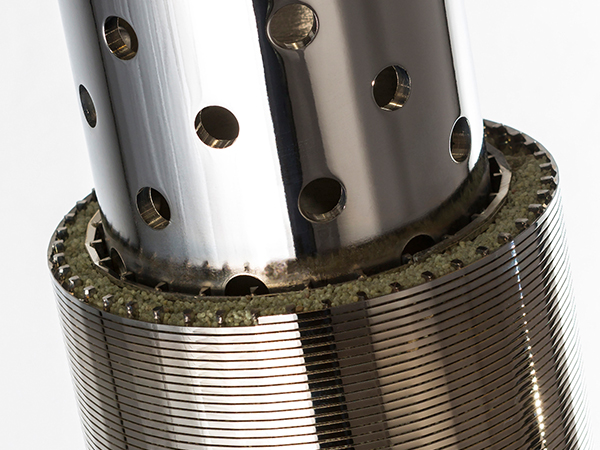
The Strategic Role of the Wedge-Wire Screen
The selection process is not just about the internal diameter; it is about the feasibility of the final hardware. The use of the Wedge-Wire screen is strategically important because its structural robustness allows for the thinner wall required to maximize the internal flow diameter ($D_i$) within a given casing size. Furthermore, its high open area minimizes the coupling friction loss ($\Delta P_{a}$), maximizing the reservoir’s ability to flow into the wellbore. The material specifications (e.g., API 5CT tubing and high-strength alloy wire) must ensure that the mechanical properties of the chosen $D_s$ are sufficient to withstand the collapse pressure during gravel packing and the tensile load during installation.
The final determination of the optimal screen diameter ($D_{opt}$) is thus the pinnacle of a rigorous, integrated analysis that links the minute physics of turbulent gas flow to the macroeconomics of hydrocarbon asset development, ensuring that the completion design achieves maximum productivity without compromising the essential requirement for long-term sand control integrity. The resulting screen size is the engineered solution that yields the highest profitability over the life of the horizontal gas well.


